squigualiser
Calculating base shift
As discussed in pore model and base shift and event alignment a base shift must be calculated to properly adjust the base color to the raw signal movements.
If the user is planning to use reform for a profile that is not listed then they may also use calculate_offsets.py to calculate appropriate kmer lenght and signal move offset value to use in the refom command.
Option 1
To calculate the kmer length and signal move offset for a dataset to use in reform use the following command.
python calculate_offsets.py -p reform.paf -s reads.blow5 -f reads.fastq
Option 2
To calculate the kmer length and signal move offset for a specific read and visualise the best base shift use the following command.
python calculate_offsets.py -p reform.paf -s reads.blow5 -f reads.fastq -o out.pdf --read_id ${READ_ID}
Option 3
To calculate and visualise the best base shift for a kmer model use the following command.
python calculate_offsets.py --use_model --model pore.model -o out.pdf
The table listing the profiles, recommended kmer lengths and the signal move offsets was calculated using Option 1
The density plots documented in pore model were calculated using Option 3
The following density plots were generated using Option 2 for a specific read to find the most significant base offset.
| profile | denisty plot file |
|---|---|
| guppy_dna_r9.4.1_450bps_fast_prom | |
| guppy_dna_r9.4.1_450bps_hac_prom | |
| guppy_dna_r9.4.1_450bps_sup_prom | |
| guppy_dna_r10.4.1_e8.2_400bps_fast | |
| guppy_dna_r10.4.1_e8.2_400bps_hac | |
| guppy_dna_r10.4.1_e8.2_400bps_sup |
The following pseudo code should help in understanding how the most significant base index is determined in Option 3
finding_the_most_significant_base(){
    for base_index_i in kmer_length:
        assume base_index_i is the most significant base
        for kmer, current_level in kmer_model:
            bin current_level to one of the four bins A,C,G and T.
            The bin is chosen looking at the base_index_i position of the kmer.
        draw four density plots one each for base in a subplot

    The differences between maximum and the minimum medians for each base index is calculated.
    The maximum difference (max_diff) is taken as the maximum distance and the corresponding base index (base_idx) is considered the significant base index.
    return  max_diff, base_idx
}
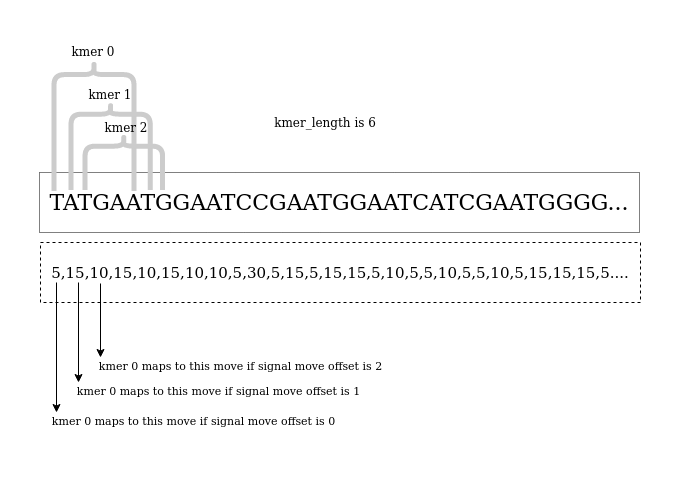
The below figure and the pseudo code should help in understanding how the best kmer_length and sig_move_offset values are determined in Option 1
DEFAULT_KMER_LENGTH = 6
best_m = 0
best_max_diff = -infinity
most_significant_base_index = 0
recommended_sig_move_offset = 0
for m in range(0,DEFAULT_KMER_LENGTH):
    create a (partial) kmer model by iterating the fastq sequence while assigning each kmer in the sequence a current value that corresponds to the level pointed by the move.
    local_max_diff, base_idx = finding_the_most_significant_base() (pass the kmer model to the finding_the_most_significant_base() as described above)
    if best_max_diff < local_max_diff:
        best_max_diff = local_max_diff
        best_m = m
        most_significant_base_offset = base_idx
        if most_significant_base_offset == 0:
            recommended_sig_move_offset = m (assumption - the recommended_sig_move_offset is the m value where the most_significant_base_offset is zero and as we increment m value by 1 also most_significant_base_offset is also incremented by 1)

confirm that the assumption is valid by checking...
if recommended_sig_move_offset == best_m - most_significant_base_offset
    then recommended_kmer_length = recommended_sig_move_offset + 1
else further analyse the density plots generated.
The assumption mentioned in the pseduo code has been valid for all guppy_dna_r9.4.1_450bps_fast_prom, guppy_dna_r9.4.1_450bps_hac_prom, guppy_dna_r9.4.1_450bps_sup_prom, guppy_dna_r10.4.1_e8.2_400bps_fast, guppy_dna_r10.4.1_e8.2_400bps_hac, guppy_dna_r10.4.1_e8.2_400bps_sup models.
For example the density plots for guppy_dna_r9.4.1_450bps_fast_prom found here are summarised in the table below.
| Plot number | Observation | sig_move_offset | best_base_offset | max_distance |
|---|---|---|---|---|
| 1 | no clear separation among the density plots | 0 | 0 | 14.2552 |
| 2 | no clear separation among the density plots | 1 | 0 | 13.1586 |
| 3 | a clear separation in the first subplot | 2 | 0 | 20.1948 |
| 4 | a clear separation in the second subplot | 3 | 1 | 20.469 |
| 5 | a clear separation in the third subplot | 4 | 2 | 20.469 |
| 6 | a clear separation in the fourth subplot | 5 | 3 | 21.7483 |
The first two plots show that the first two moves in the move array are not relevant.
However, starting from the third plot we see a clear separation and the separation continues to shift by 1 as we increment the sig_move_offset.
So we pick the sig_move_offset for which we first observe the clear separation (sig_move_offset = 2).
Even though max_distance is 21.7483 and corresponds to sig_move_offset = 5; since (2 == 5 - 3), we have picked the correct value.