squigualiser
Pore model
For different nanopore chemistries we have different pore models. These pore models have different kmer lengths, current levels and standard deviations. This is the official repository to find the pore models. Nanopolish uses pore models to do different signal - read alignments. F5c (an improved version of nanopolish) hence, also uses pore models.
At a time, all the bases of the kmer inside the nanopore influence the current/voltage level.
However, not all the bases equally contribute to this phenomenon.
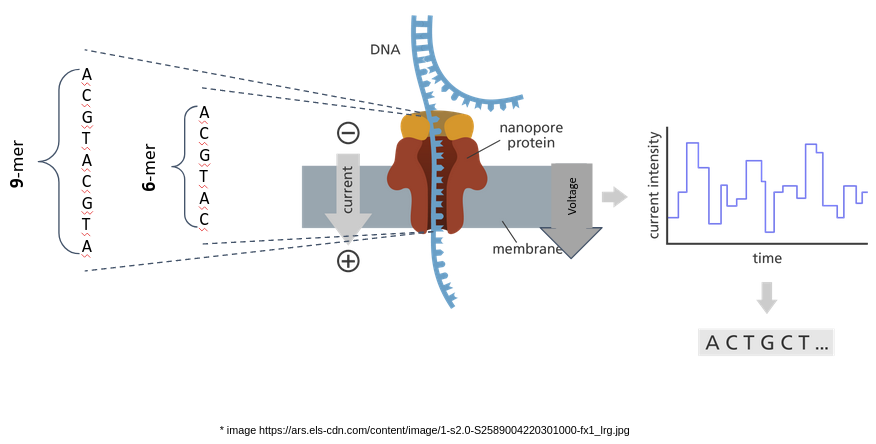
Depending on the size of the nanopore the kmer residing inside the pore can vary in length. In addition, depending on how the kmer-model was generated, the most significant base may or may not be the base at the center of the kmer.
We can find the position of the most contributing base by analysing the degree to which each base in the kmer can separate A, C, G, and T/U.
| Chemistry | kmer size | Figure no | Significant base index (0 based) | Link to the model |
|---|---|---|---|---|
| dna_r9.4.1_450bps | 5_mer | 1 | 2 | r9.4_450bps.nucleotide.5mer.template.model |
| dna_r9.4.1_450bps | 6_mer | 2 | 2 | r9.4_450bps.nucleotide.6mer.template.model |
| rna_r9.4.1_70bps | 5_mer | 3 | 1 | r9.4_70bps.u_to_t_rna.5mer.template.model |
| dna_r10.4.1_e8.2_400bps | 9_mer | 4 | 6 | dna_r10.4.1_e8.2_400bps/9mer_levels_v1.txt |
Please note that the current values in the dna_r10.4.1_e8.2_260bps model above is normalized. It is not necessary to transform the values to pA domain for our analysis. However, one can do the transformation as follows,
sigtk pa -n dna_r10.4.1_e8.2_260bps_reads.blow5 | cut -f3 | sed 's/,/\n/g' | datamash mean 1 sstdev 1
pA_value = normalized_value * std + mean
sigtk can be found here
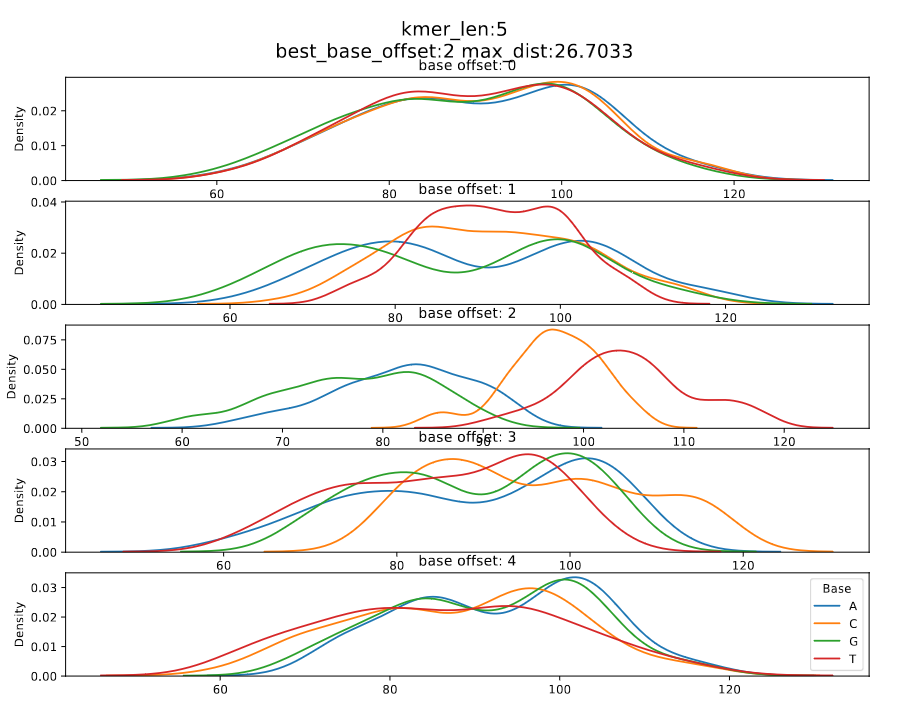
Figure 1: dna_r9.4.1_450bps_5_mer
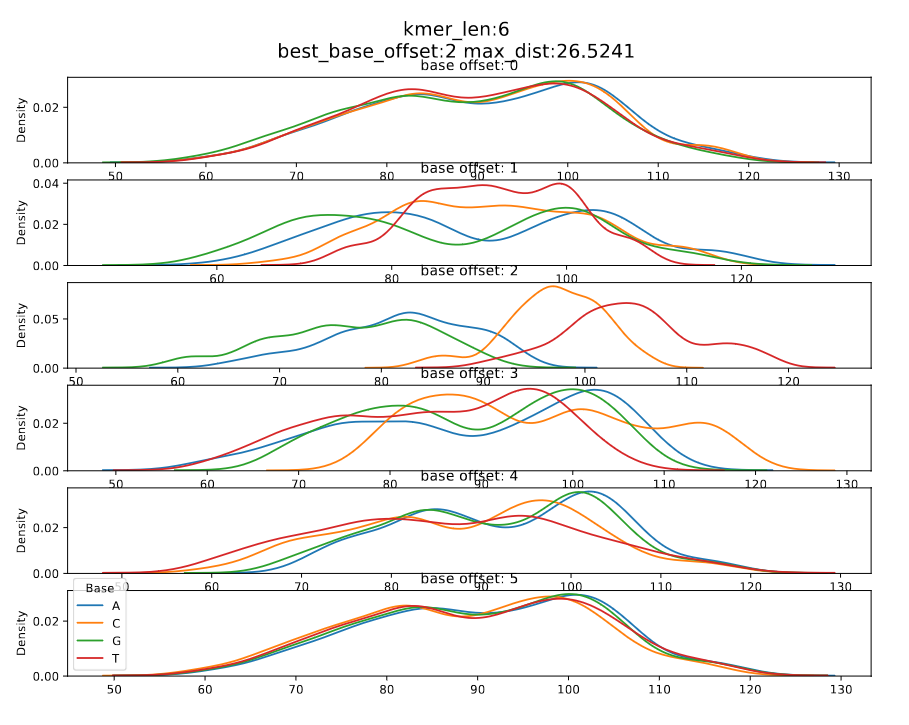
Figure 2: dna_r9.4.1_450bps_6_mer
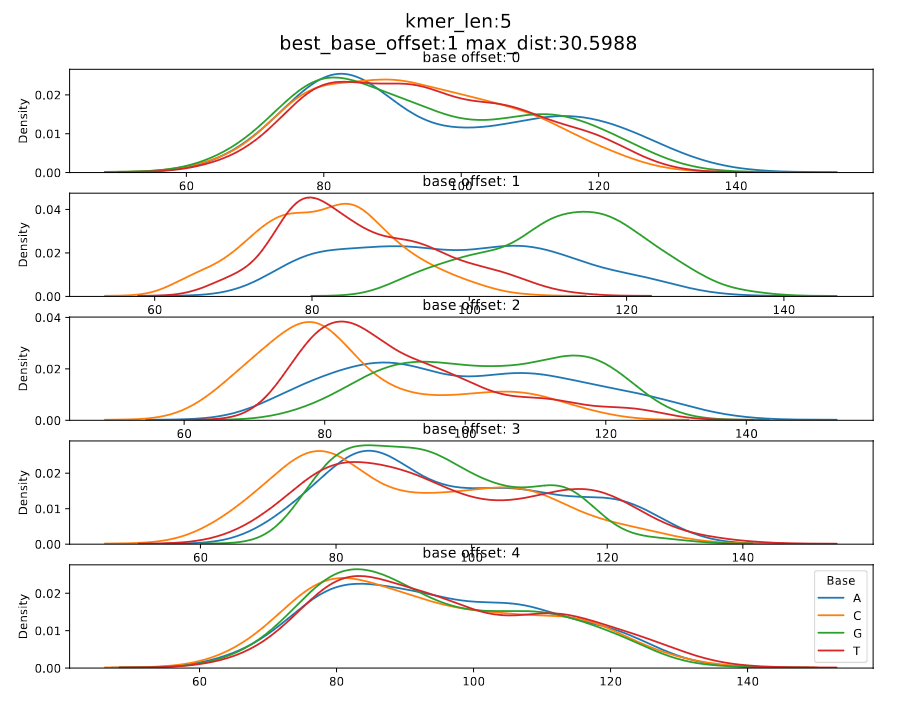
Figure 3: rna_r9.4.1_70bps_5_mer
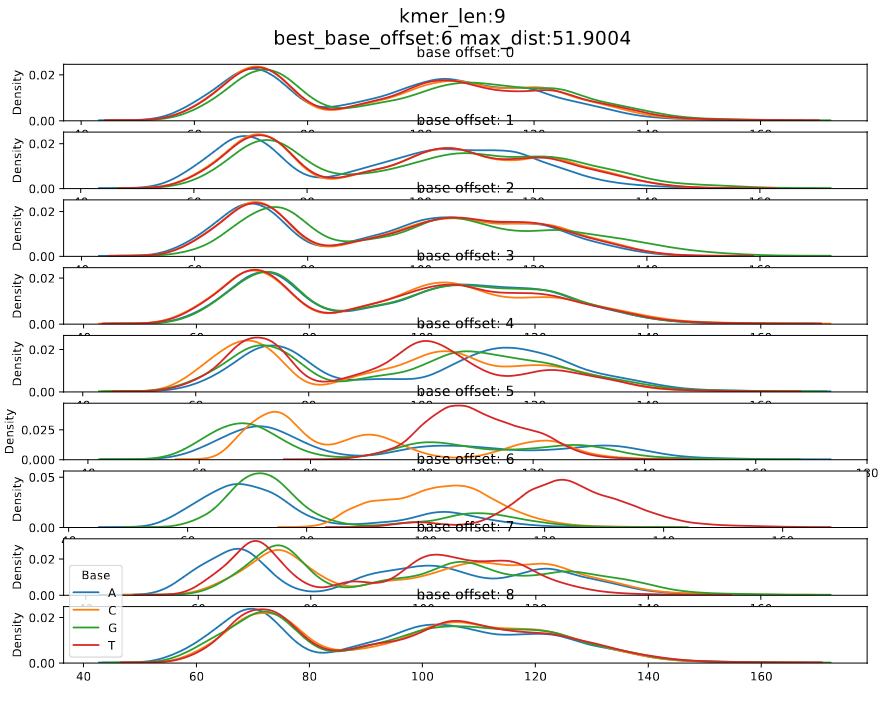
Figure 4: dna_r10.4.1_e8.2_400bps_9_mer
In DNA models, looking at the current densities for each nucleotide of the most contributing base index, we can see that the median current of a nucleotide is in the order A < C < G < T, i.e., the median current value of T and A are the maximum and minimum respectively.
The code to generate above plots is given below, If the user want to generate such plots for a new kmer model the following command can be used. More information about this command can be found at calculate offsets.
squigualiser calculate_offsets --use_model --model ${MODEL_PATH} -o ${OUTPUT_PDF_PATH}
The following is the pseudo code for plotting density plots
for base_index_i in kmer_length:
    assume base_index_i is the most significant base
    for kmer, current_level in kmer_model:
        bin current_level to one of the four bins A,C,G and T.
        The bin is chosen looking at the base_index_i position of the kmer.
    draw four density plots one each for base in a subplot
The differences between maximum and the minimum medians for each base index is calculated. The maximum difference is taken as the maximum distance and the corresponding base index is considered the significant base index.